The LRC continues to cycle right on schedule. The pattern this year is a complicated one with many influences acting on the pattern collectively but the pattern is absolute and is cycling regularly.
The LRC which stands for Lezak Recurring Cycle is named after meteorologist Gary Lezak, the founder of the LRC and the weather forecasting company Weather2020. The LRC methodology, simply put is that each fall, a new unique weather pattern sets up varying in length each year, then cycles through the following year until a new pattern forms for the following fall. In most years the LRC cycle lasts anywhere between 40-60 days but can be shorter or longer. Once the pattern length can and has been identified, one can use the methodology to determine what the weather pattern is going to look like through the following year and predict when large-scale features that would heighten a higher probability of storms, heat waves, cold snaps…etc will occur.
There are influences that act on the LRC such as seasonal differences, El-Nino and La-Nina, the Arctic Oscillation, as well as others. However, the LRC is the centerpiece of the puzzle for forecasting especially long term, which is really anything more than 10-14 days, upwards of 9-10 months.
The LRC is not a perfect forecasting tool, but with an accuracy of 70-80+% upwards of 6-9 months in the future, it is beyond a homerun in terms of weather forecasting and predictions. Today’s numerical weather forecasting models can’t even consistently come close to that more than 10-14 days out. The LRC is a patent pending model and in my opinion and others, ‘The forecasting model of tomorrow’.
There has been quite a bit of controversy and skepticism surrounding the LRC, as most things that are new, that goes against what is thought to be known, or not what you were taught. It will be the next generation of weather forecasting long term in my opinion. Gary is making worldwide news about the LRC and it is growing in users as well as credibility. But there of course will be nay-sayers and skeptics. Rightfully so though!
In the science world controversy and skepticism is a good thing. I myself was a full skeptic as well when I was first introduced to the LRC three years ago. “There is no way this is possible,” I said back in 2020. That’s the same thing that numerous others are also saying, or at least trying to say. If you cant see how it works I don’t blame you for being skeptical. But to be blind and immediately say it’s impossible, in a way is ignorance if you’re unwilling to try and learn more about the LRC or accept the concept. Unless you understand the LRC, its methodology, and how to use it, I can understand how it may be hard to accept, but it is 100% real and does works!
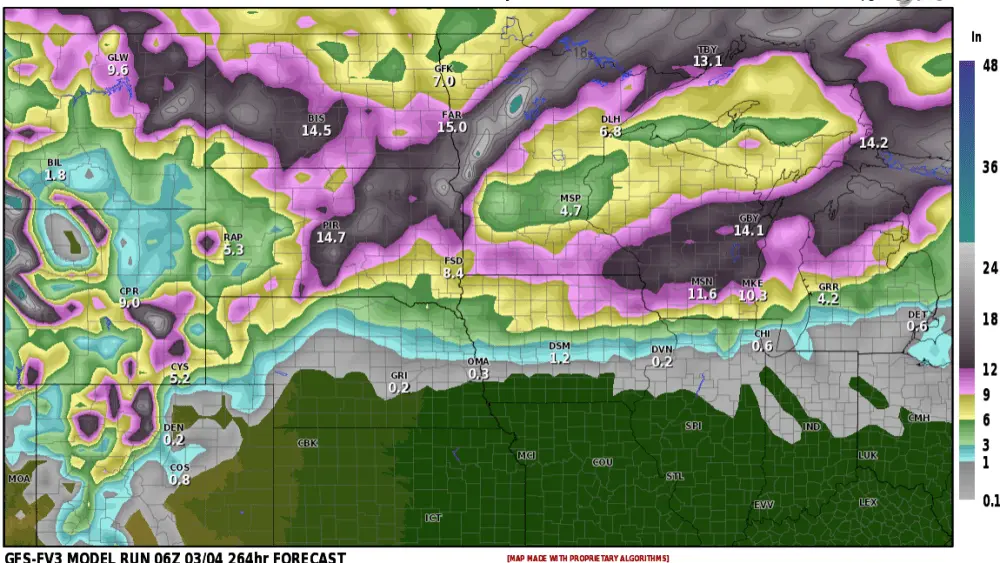
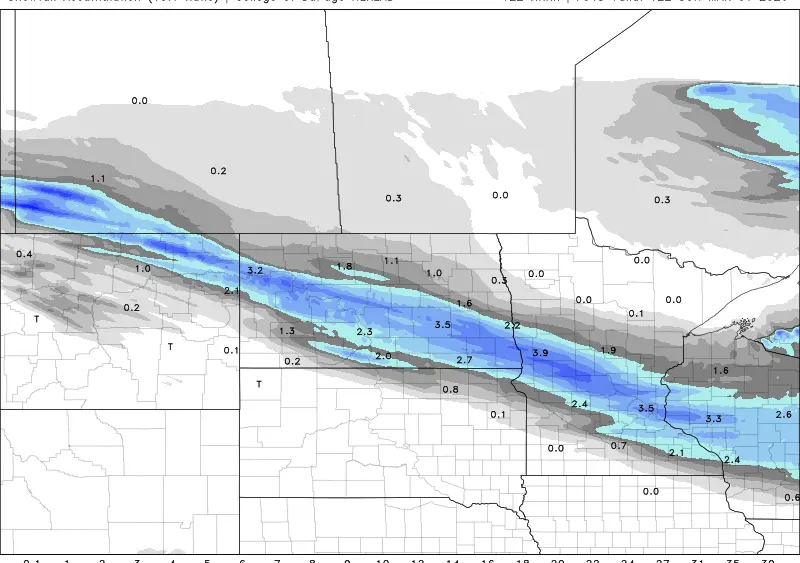
I’ll show you one quick example of the LRC in action. Last year’s LRC cycle was identified at about 63.5 days in length. The cycle oscillated at 62-65 days in length but averages out at 63.5 days. Last year’s signature storm followed this to a tee (Image 1). Reappearing roughly every 63.5 days, See images 1 and 2 below. This map shows the upper-level atmospheric pattern at 500 MB, as well as the severe weather risk outlook for the corresponding timeframes. This feature was responsible for several severe weather events and outbreaks, including a tornado threat in the Red River Valley in October, and a historic wind storm in December that brought tornadoes into Minnesota and Wisconsin. In February, April, and June another severe weather threat was produced by ‘this’ storm system. All of these severe weather threats were forecasted with the LRC back in mid-December after the pattern length was identified.


Now for this year’s LRC pattern.
Blocking has been a major influence on the LRC throughout this spring and early summer. Which usually does not occur especially to this extent. On one way or another, there has been ongoing blocking for more than 6 weeks which has caused a lot of our storm systems to wobble north, south, and west, leaving portions of North Dakota, Minnesota, and South Dakota drier than anticipated, as well as a couple of weeks of some pretty hot weather in June. The storm systems have been cycling right on time, they have just been misplaced by the blocking. See the images below of how blocking can deflect storm systems.
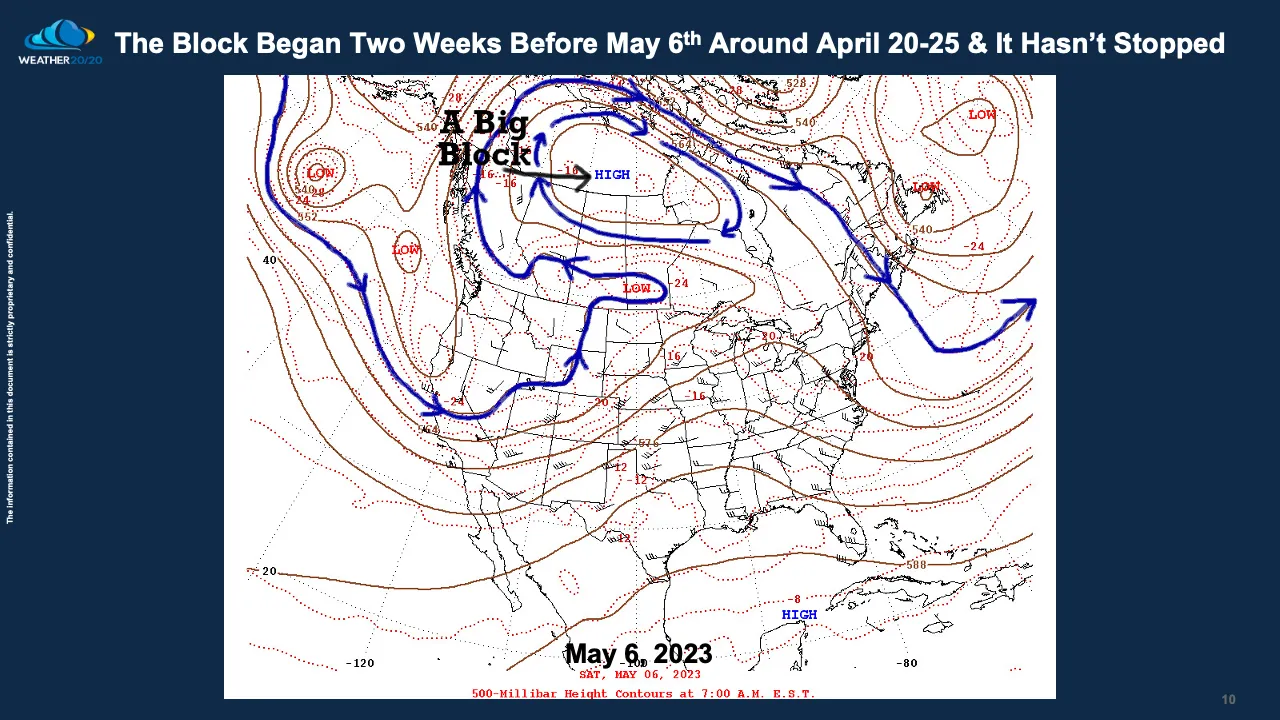
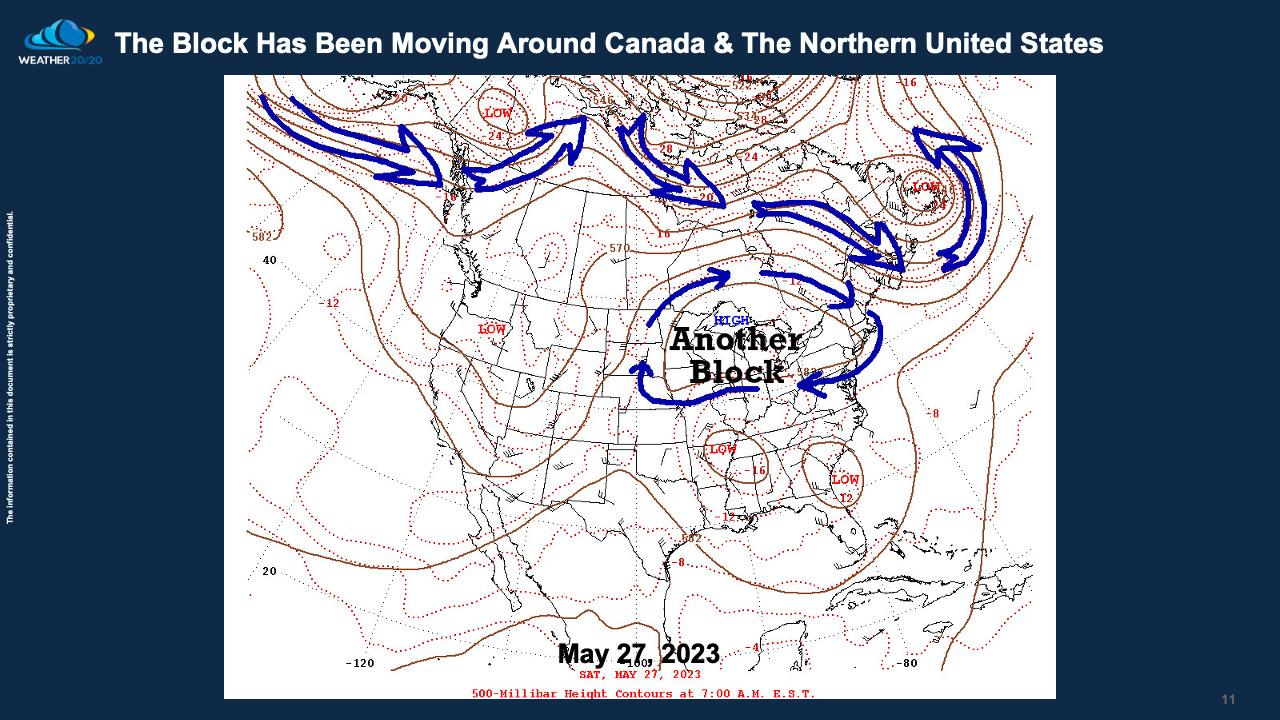
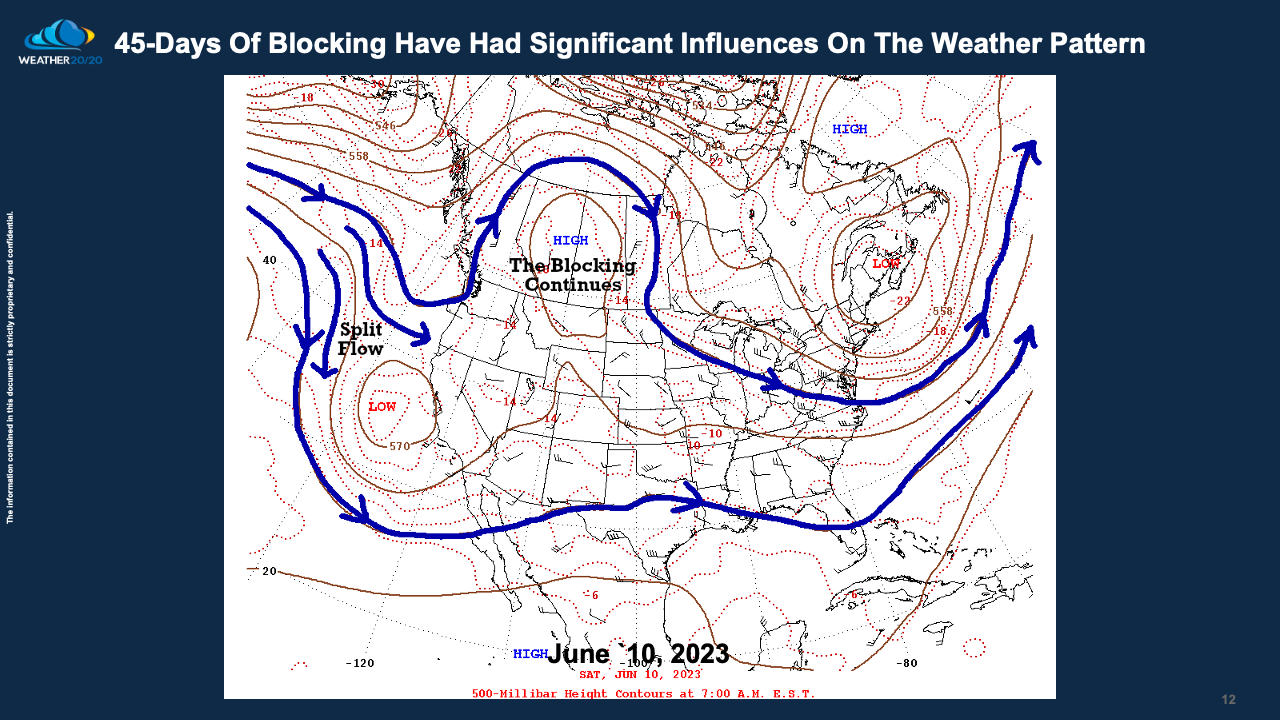
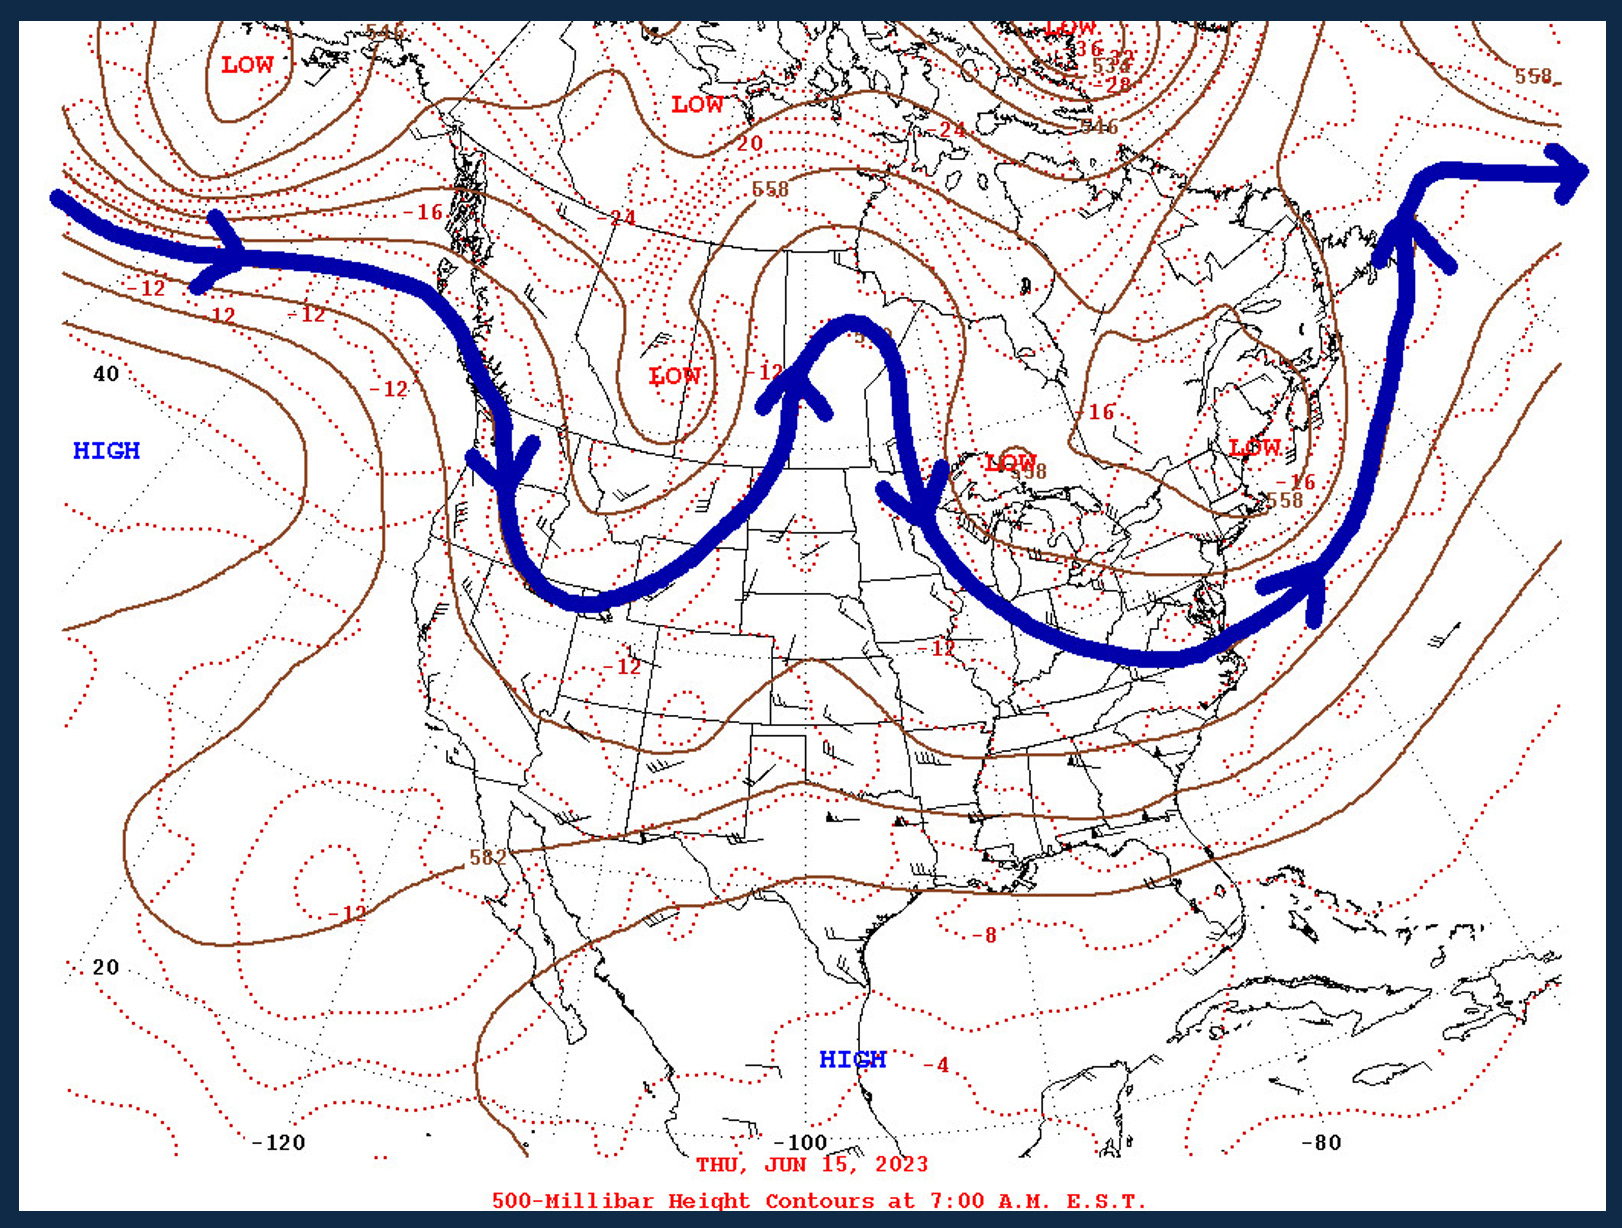
The main storm track has been pushed around to areas north, west, and south due to the upper-level blocking but as blocking lessens, the storm track should begin to return more ‘normal’ and to what was originally forecasted through portions of Nebraska into the Dakotas and Minnesota, as well as Wisconsin.


The darker area is where the higher amounts of rainfall are expected to fall. In the lower right-hand corner, a bar graph shows precipitation. Each bar is 1 week, bars above 100% would indicate a wet week while bars below 100% indicate a dry and or drier week.
We are currently In the sixth cycle of this year’s LRC. This portion of the calendar lines up perfectly with what occurred back in December around Christmas time. Do you remember around Christmas of 2022? It was very cold… We just experienced this last week and this week as unseasonable cool weather spread over North Dakota. Check out the image below, this is the upper-level weather pattern from back then to now. We will soon break out of this cooler weather and turn warmer as the ridging on the west coast tracks east. This will lead into possible intermittent heat the last week of July into the first couple weeks of August. But the heat will favor south and East.

Now for the calendar
July -> September
Let me explain how I’m doing this. I will be highlighting ‘windows’ for when I expect an upper-level wave that would support a higher probability of precipitation or storms in our area. Red corresponds to more likely, yellow represents less likely but possible, and or could develop out of our area. Im not highlighting every minor chance for rain. In some instances, there will be three days circled. This doesn’t necessarily mean that all three days will storm, but within that time frame, I expect an upper-level wave to track through ‘our area’ that could support a chance of bad weather ie storms, and rain. Some instances may result in most of the day being dry and decent but then a passing warm/cold front pushes through and we get some storms that develop along it, or perhaps an overnight event. Due to influences that act on the LRC pattern, a couple of these systems may ‘wobble’ and push further north, south, east… etc.


This year’s LRC pattern will soon begin to break down at the end of September and a new pattern will begin in October.
Gary offers a newsletter-style custom forecast dedicated to helping people know what the weather is doing, and what it will do several months down the road with a proven track record and accuracy of up to 80+%. Gary is 3-3 and about the be 4-4 on his severe weather outlooks ranging from 50-150 day outlooks for 2023. You can visit his website and signup for his forecast, which can help you plan accordingly for your business, recreation plans, and or agribusiness here https://weather2020.substack.com
Meteorologist,
Justin Storm